
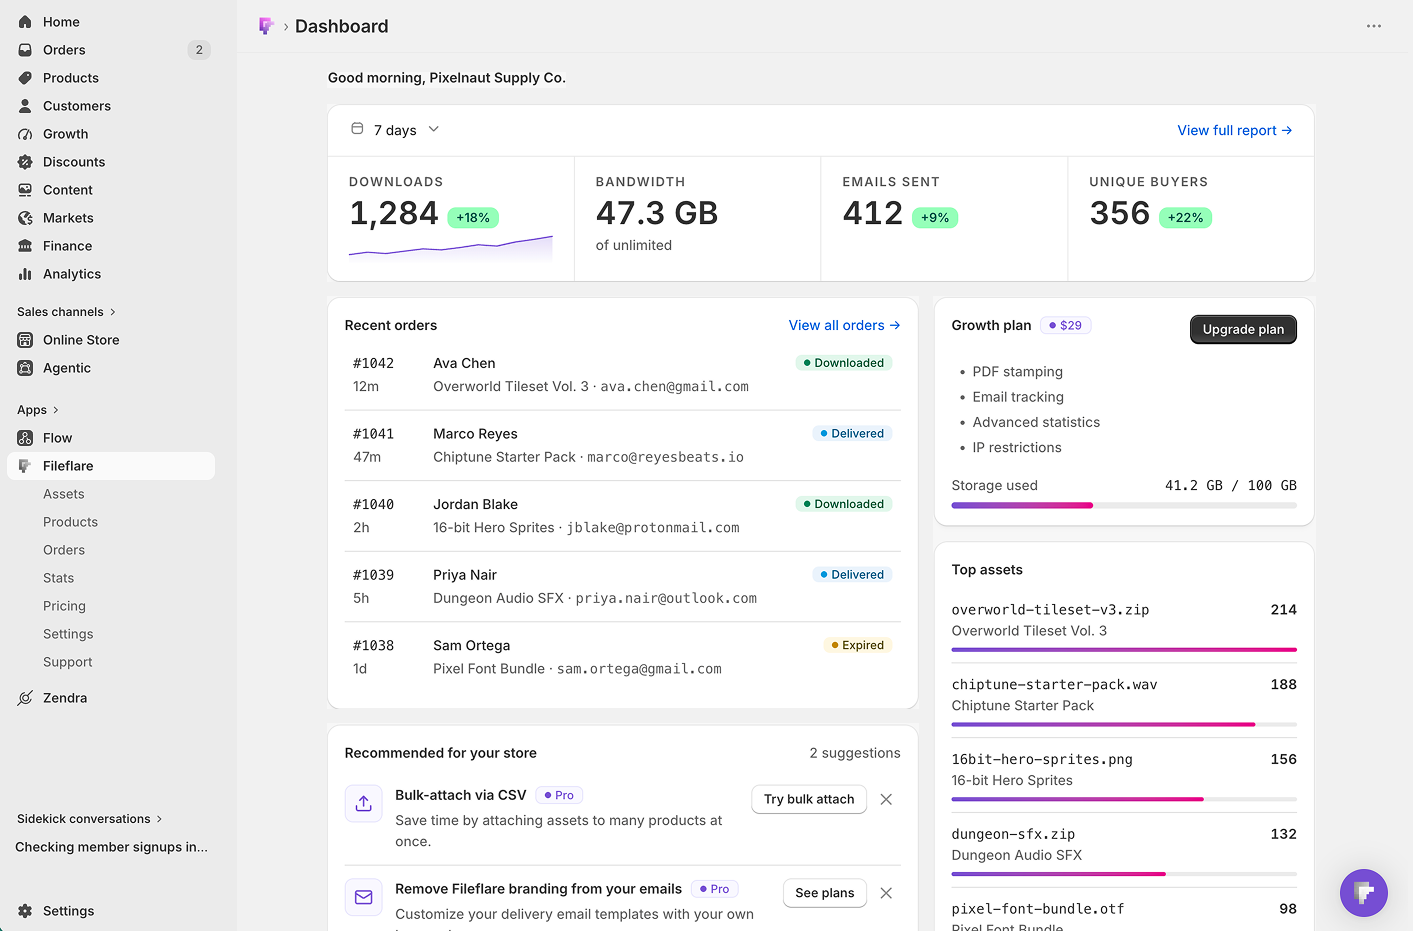
The Fileflare dashboard is your home screen inside the Shopify admin. It leads with your key download stats over a date range you choose, then gives you at-a-glance cards for your plan and storage, recent orders, top assets, and a few helpful recommendations. Available on every plan, no setup required.
When you’d use this
- You just opened Fileflare and want a quick read on how delivery is going.
- You want to check downloads, digital orders, or emails sent over a specific stretch of time.
- You want to see how much storage you’re using against your plan, or jump to a recent order or a top-performing asset.
How it works
The dashboard is built from a few pieces, top to bottom.
Stats hero
The stats hero sits at the top and shows your headline download numbers — downloads, digital orders, and emails — over a selectable date range. Each stat includes a small sparkline so you can see the trend at a glance, plus a change indicator comparing the current range to the period before it.
These demand numbers reflect real customer activity: your own downloads are left out of the counts, so testing your files or spot-checking a delivery yourself won’t inflate the stats. What you see is what your shoppers are actually doing.
Use the date-range selector at the top of the hero to switch the window (for example, last 7 days, last 30 days, or a custom range). Every stat and sparkline updates to match.
Cards
Below the hero, a set of cards surfaces the things you check most:
- Plan & storage. Your current plan and how much storage you’ve used against your limit. If you serve files from your own S3 or R2 bucket, the storage meter is left off this card and on the Statistics page, since your plan’s storage quota doesn’t apply to you — the card still shows your plan and what it includes.
- Recent orders. The latest digital orders, with a link into each one.
- Top assets. Your most-downloaded files.
- Recommendations & resources. Suggested next steps and links to help docs and guides.
Recommendations and alerts
The dashboard surfaces contextual recommendations (setup suggestions, things worth turning on) and alert notices (account or status notices) as dismissable banners. Once you’ve handled one — or decided it’s not for you — dismiss it and it stays gone for your shop.
System status bar
A status bar reflects Fileflare’s current operating status, so you can tell at a glance whether everything’s running normally.
New to Fileflare?
If your store is just getting started, the dashboard greets you with a guided onboarding experience instead of the full stats view — a short stepper that walks you through attaching a product and sending a test order. Once you’ve completed (or dismissed) onboarding, the full dashboard takes over. See Getting started: your first digital product for the walkthrough.

Common issues
- Stats look low or empty. Check the date range in the stats hero — a narrow or recent window may simply have little activity. Widen the range to see more. (Your own downloads don’t count toward these numbers, so previewing your files yourself won’t show up here.)
- The dashboard still shows onboarding steps. Onboarding stays until its steps are completed or dismissed. You can dismiss steps you’ve already handled to clear them.
- Storage looks higher than expected. The plan & storage card counts every asset uploaded to Fileflare’s managed storage. Removing unused assets frees the space back up.
- There’s no storage meter on the card. That’s expected on custom storage. Shops serving files from their own S3 or R2 bucket aren’t drawing on a plan storage quota, so Fileflare leaves the meter off rather than showing a number that doesn’t apply. Check usage in your AWS or Cloudflare console instead.